# 3. Risk Management Dashboard
{% hint style="info" %}
This is an abridged version of the user guide, highlighting essential features. To access the full version with detailed steps, kindly reach out to your dedicated Account Manager.
{% endhint %}
The Risk Management Dashboard allows you to track your profits over time and provides projected profit analysis based on the hybrid A/B book risk management model. You will also have valuable insights on the top five most profitable traders and the top five traders with the most losses. This enables you to make more informed decisions as a broker, optimizing your A-book and B-book strategies to maximize returns.
This function is only available for brokers with MT4/5.
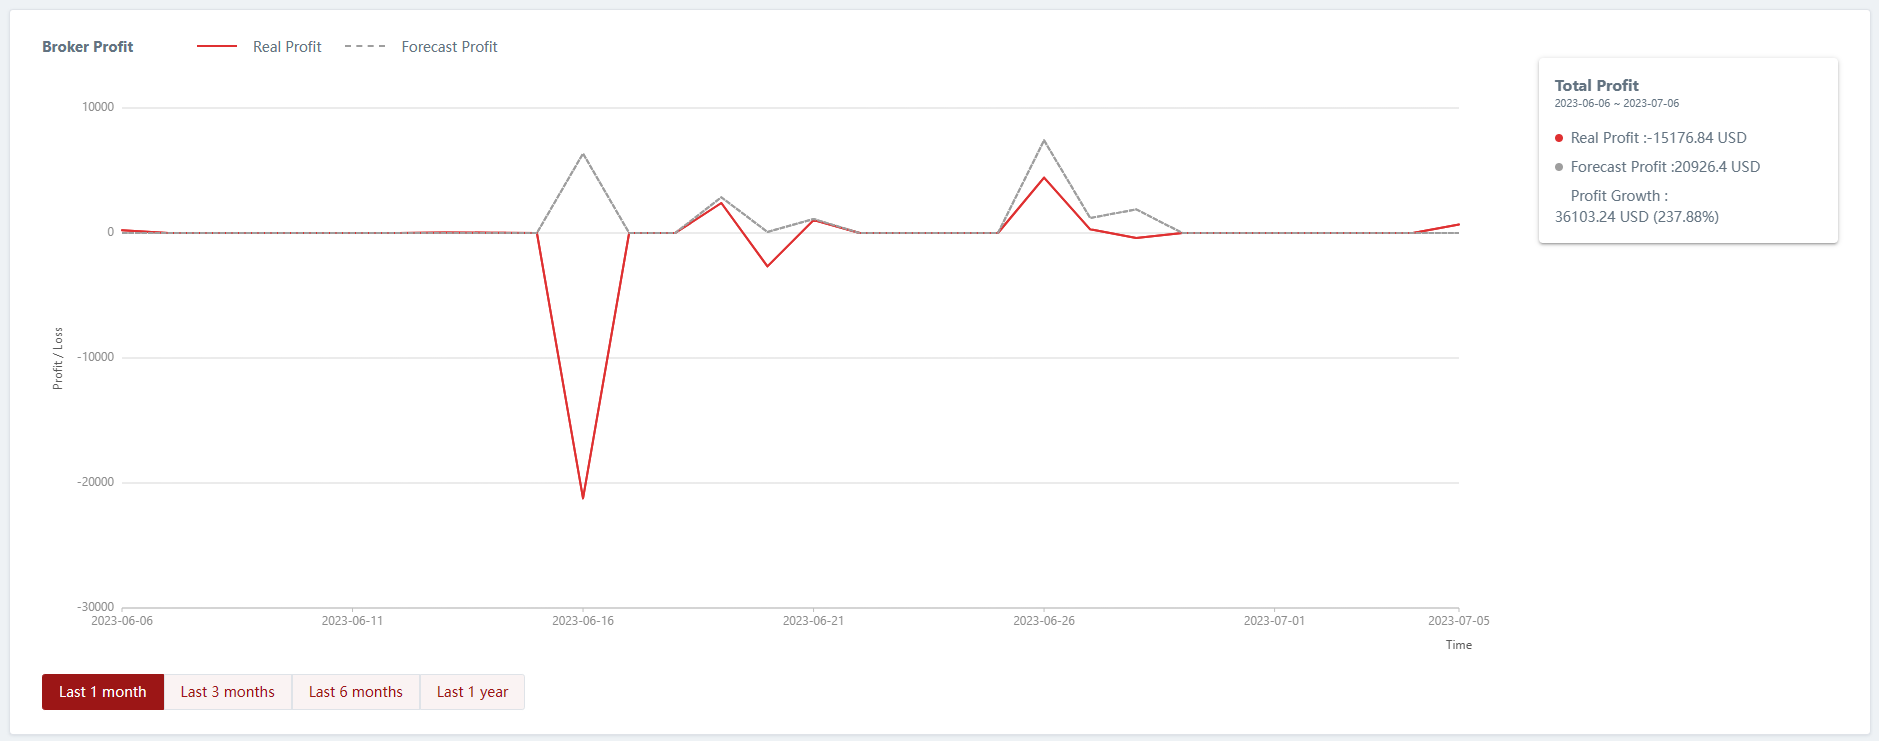
### Broker Profit and Loss Chart
This chart provides a comprehensive view of your profits, projected profits, and profit growth over a specified period of time. This visual representation allows you to track and analyze your financial performance, enabling you to make informed decisions and strategies for maximizing profitability.
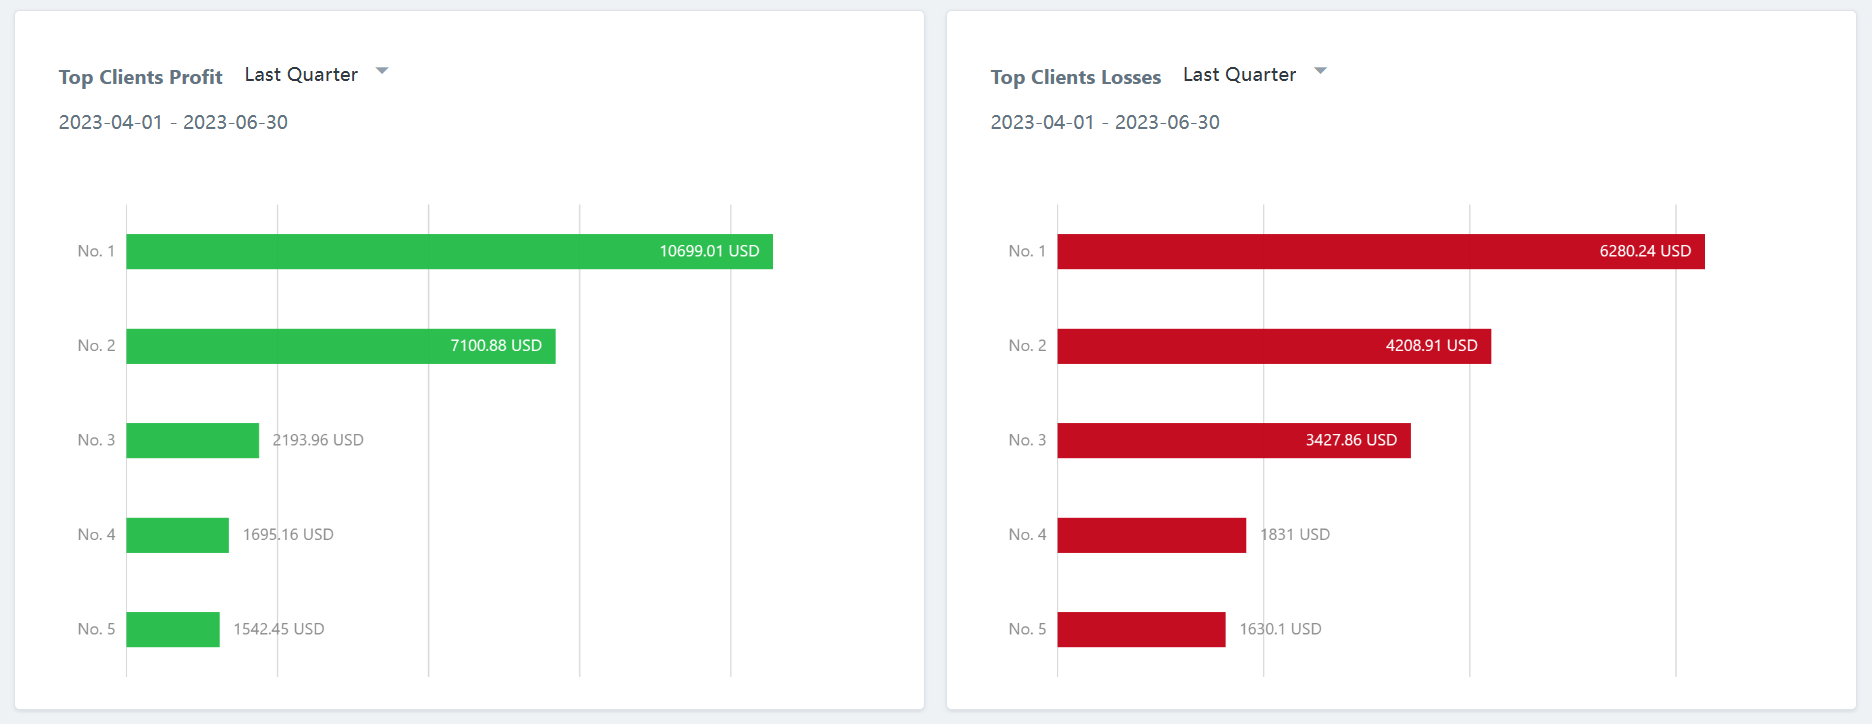
### Top 5 Most and Least Profitable Traders
Within the risk management dashboard, you will have visibility of the top 5 most profitable traders on the left side and the top 5 least profitable traders on the right side. All profit amounts will be denominated in USD, even if the clients have different account base currencies. The system will automatically convert the profits to USD.
---
# Agent Instructions: Querying This Documentation
If you need additional information that is not directly available in this page, you can query the documentation dynamically by asking a question.
Perform an HTTP GET request on the current page URL with the `ask` query parameter:
```
GET https://reference-guide.gitbook.io/crm-back-office-user-guide-abridged/3.-risk-management-dashboard.md?ask=
```
The question should be specific, self-contained, and written in natural language.
The response will contain a direct answer to the question and relevant excerpts and sources from the documentation.
Use this mechanism when the answer is not explicitly present in the current page, you need clarification or additional context, or you want to retrieve related documentation sections.