> For the complete documentation index, see [llms.txt](https://reference-guide.gitbook.io/crm-back-office-user-guide-abridged/llms.txt). Markdown versions of documentation pages are available by appending `.md` to page URLs; this page is available as [Markdown](https://reference-guide.gitbook.io/crm-back-office-user-guide-abridged/2.-dashboard.md).
# 2. Dashboard
{% hint style="info" %}
This is an abridged version of the user guide, highlighting essential features. To access the full version with detailed steps, kindly reach out to your dedicated Account Manager.
{% endhint %}
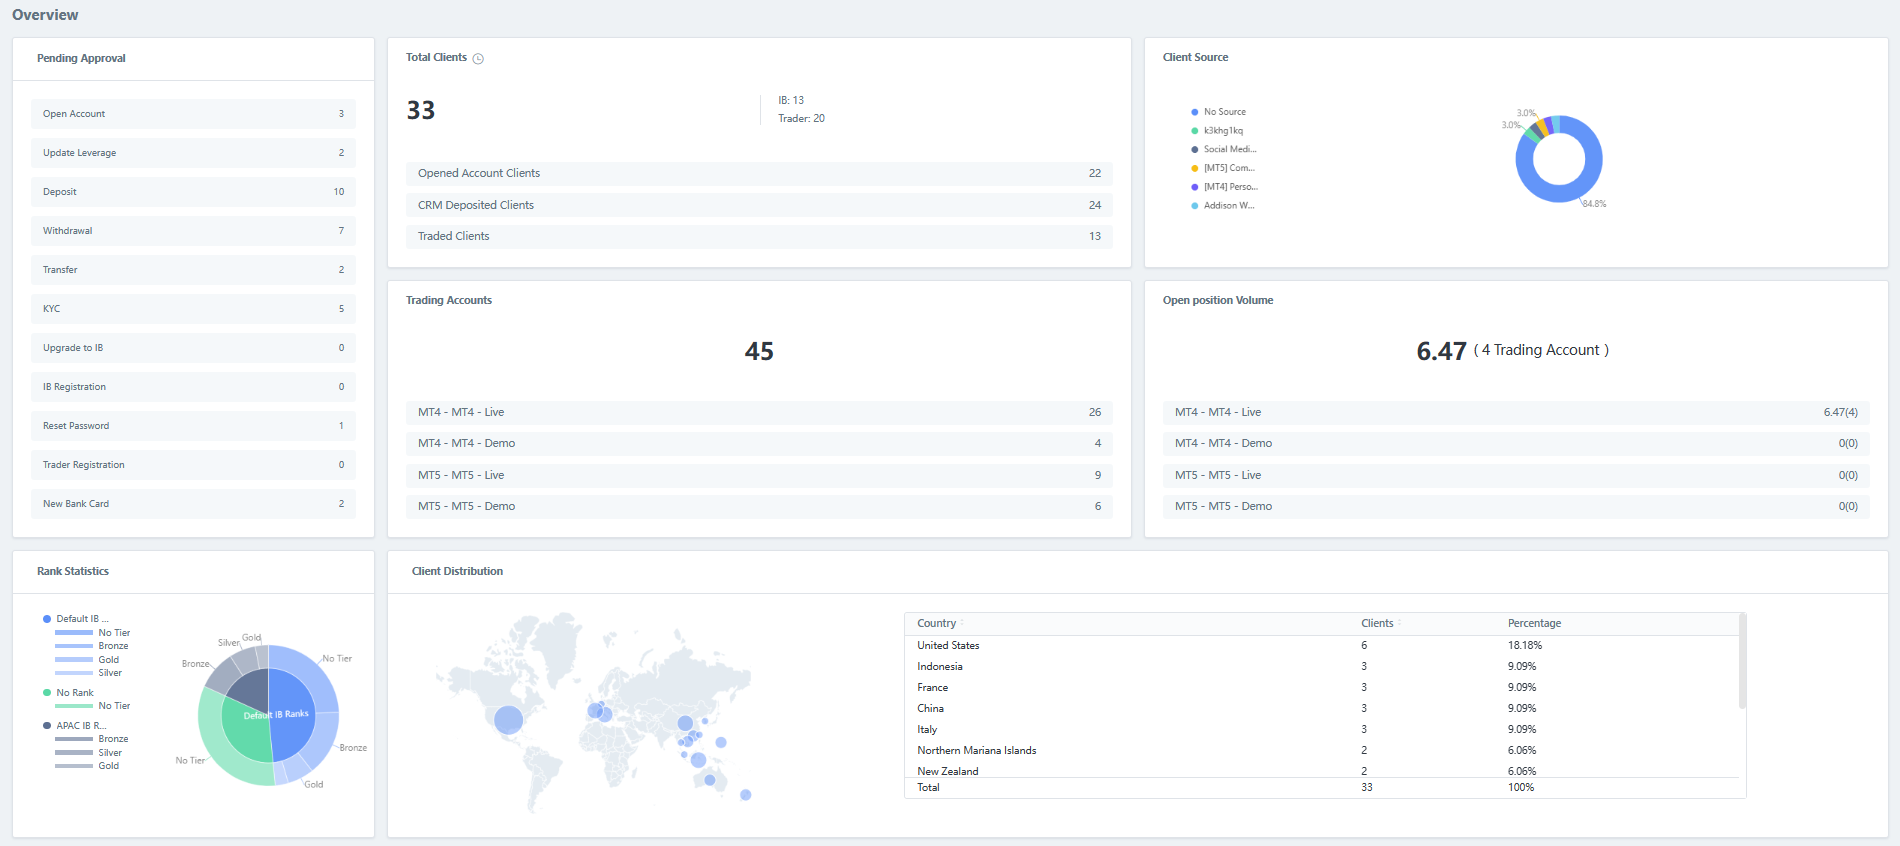
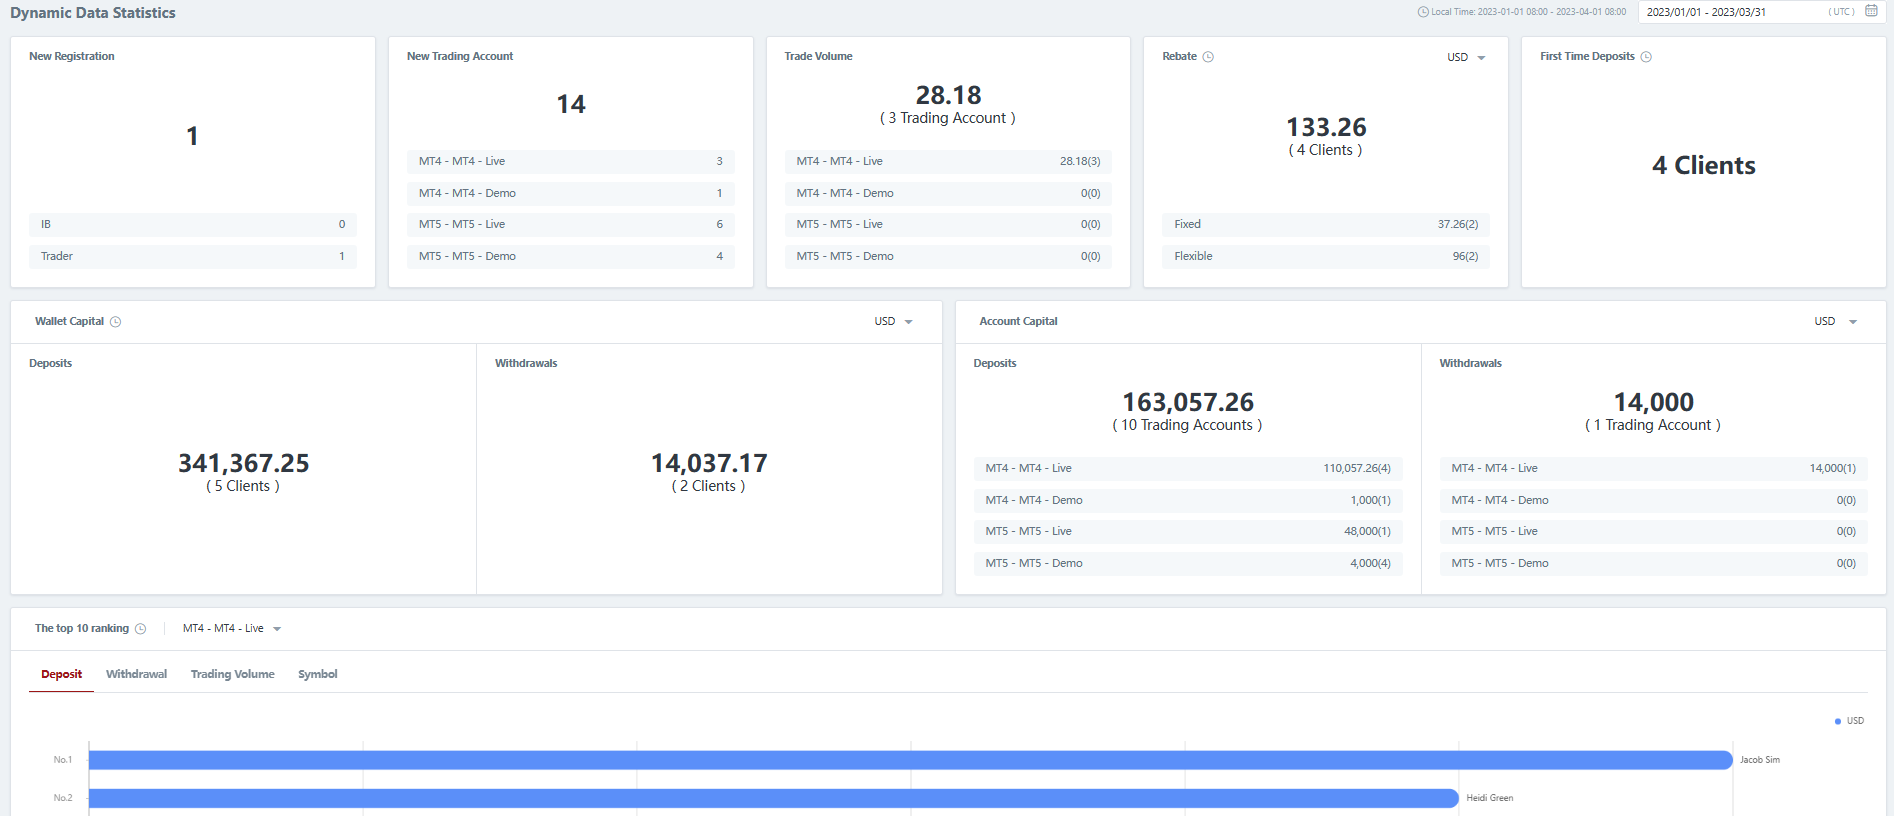
The CRM Dashboard is a valuable tool for brokers, offering a comprehensive view of clients, Introducing Brokers (IBs), and overall business operations. It consists of two distinct sections:
1. Static Data Statistics: This section provides automatically generated statistics based on essential data. These statistics give brokers an immediate snapshot of critical information, enabling quick assessments of their operations' status.
2. Dynamic Data Statistics: In this section, the dashboard presents dynamic data statistics. Unlike static data, these statistics are also generated by the system, but they come with the flexibility to customize the date range.