# V7.29.0 - Unlock Deeper Insights with the New Prop Challenge Dashboard & Data Type Functionality
**Released Date - 4 December 2024**
We’re excited to unveil the all-new Prop Challenge Dashboard—now more intuitive and powerful than ever. Designed to provide a clearer and more detailed overview of your prop trading business, it makes tracking key metrics like financial performance, participant numbers, and trader success rates simpler and more precise. The new 'Data Type' functionality lets you classify participants as test accounts or live clients, ensuring your data remains accurate and meaningful. We've also enhanced the Prop Challenge Reports with advanced analytics to help you make smarter, data-driven decisions. Dive in to explore these exciting updates.
### Key Function Highlights
1. [**Reimagined Prop Challenge Dashboard**](#id-1-reimagined-prop-challenge-dashboard): Experience improved visibility into your prop trading operations into your prop trading performance, including financial metrics, participant engagement, and trader success rates.
2. [**Data Type Functionality**](#id-2-data-type-functionality): Tag your prop traders as "Real" or "Demo" to ensure your Prop Challenge Dashboard reflects only live client data, providing cleaner and more actionable insights for effective decision-making.
3. [**Enhanced Reporting Capabilities** ](#id-3-enhanced-reporting-capabilities)
1. [**Participant Report with Improved Filtering**](#a-participant-report-with-improved-filtering): Quickly identify participant activity with the newly added "Challenge ID" and "Challenge Name" fields, making it easier to track which challenges they are enrolled in and enhancing overall clarity.
2. [**New 24-Hour Filter**](#b-new-24-hour-filter): Analyse participants' short-term performance by viewing the movement of balance and equity over the last 24 hours, offering valuable insights into traders' recent profitability and performance trends.
### 1) Reimagined Prop Challenge Dashboard
Experience improved visibility into your prop trading operations into your prop trading performance, including financial metrics, participant engagement, and trader success rates.
#### A) Permission Rights
To view the Prop Challenge Dashboard, you will need to enable the respective permissions:
#### B) Prop Challenge Dashboard Insights
Once the respective permissions are enabled, you can access the "Dashboard" in the side menu. Click on it to view the Prop Challenge Dashboard.
The Prop Challenge Dashboard includes the following:
1. Financial Overview
2. Participants Statistics
3. Challenge Performance Statistics
On the Prop Challenge Dashboard, you can tailor the insights to your needs by filtering the chart based on challenge status and time frame.
#### C) Financial Overview
1. The financial overview chart provides a detailed snapshot of your prop business's financial performance, including key metrics such as profit, loss, profit-sharing payouts, participation fees, and the total funded amount.
1. Broker's Profit = Total trading profit – total profit sharing paid to traders
2. Broker's Loss = Equity at the time of challenge failure - Initial Amount
3. Profit Sharing Payout = Total amount of profit sharing paid out to traders
4. Participation Fee = Total participation fee collected from trader
5. Total Funded Amount = Total funded amount of trading accounts
2. The financial overview chart exclusively displays data from prop challenge stages where profit-sharing is enabled. If profit-sharing is not enabled, the corresponding data will neither be calculated nor shown.
3. Hover your cursor over the chart to view detailed insights for each prop challenge.
4. Tooltips have been added to the chart legend to provide further clarity on the figures. Simply hover over the "?" icon for explanations. Use Cases for Financial Overview Chart
1. **Evaluating the Success of Demo Challenges in Filtering Skilled Traders**
1. The chart helps you analyze your trader's profit and loss from live challenges to determine the effectiveness of the demo stage in identifying skilled traders.
1. A higher broker profit in live challenges suggests that the demo stage successfully identified traders capable of generating profits in the live environment.
2. Conversely, a higher level of broker losses may indicate that the demo stage did not effectively screen for skilled traders. This insight prompts you to adjust demo challenge parameters to ensure only qualified traders advance.
2. By comparing revenue and loss across challenges, you can refine the demo-to-live transition process and improve their selection criteria for better outcomes.
2. **Evaluating Challenge Attractiveness**
1. You can analyze total participation fees collected across challenges to assess their appeal to your traders.
2. Challenges with higher participation fee revenue indicate greater trader interest and engagement.
3. Underperforming challenges may signal issues with their structure or parameters, such as difficulty level, participation fees, or trading conditions, making them less attractive to traders.
4. With these insights, you can consider to:
1. Adjust the parameters of underperforming challenges to enhance their appeal.
2. Increase marketing efforts to raise awareness of these challenges.
5. This analysis enables you to refine your offerings and optimize strategies for attracting traders while maximizing revenue.
3. **Evaluating Risk Exposure and Return on Investment (ROI)**
1. The chart allows you to compare the total funded amount with the revenue generated for each challenge. Revenue is calculated as the sum of broker revenue and participation fees collected.
2. A low ROI, where the total funded amount significantly exceeds the revenue generated, may indicate excessive risk exposure relative to returns.
3. This imbalance suggests that you should reconsider your funding strategies, such as reducing the funded amount or lowering profit-sharing payouts, to optimize the ROI.
4. By aligning risk with profitability, you can enhance financial sustainability and ensure the long-term viability of your challenges.
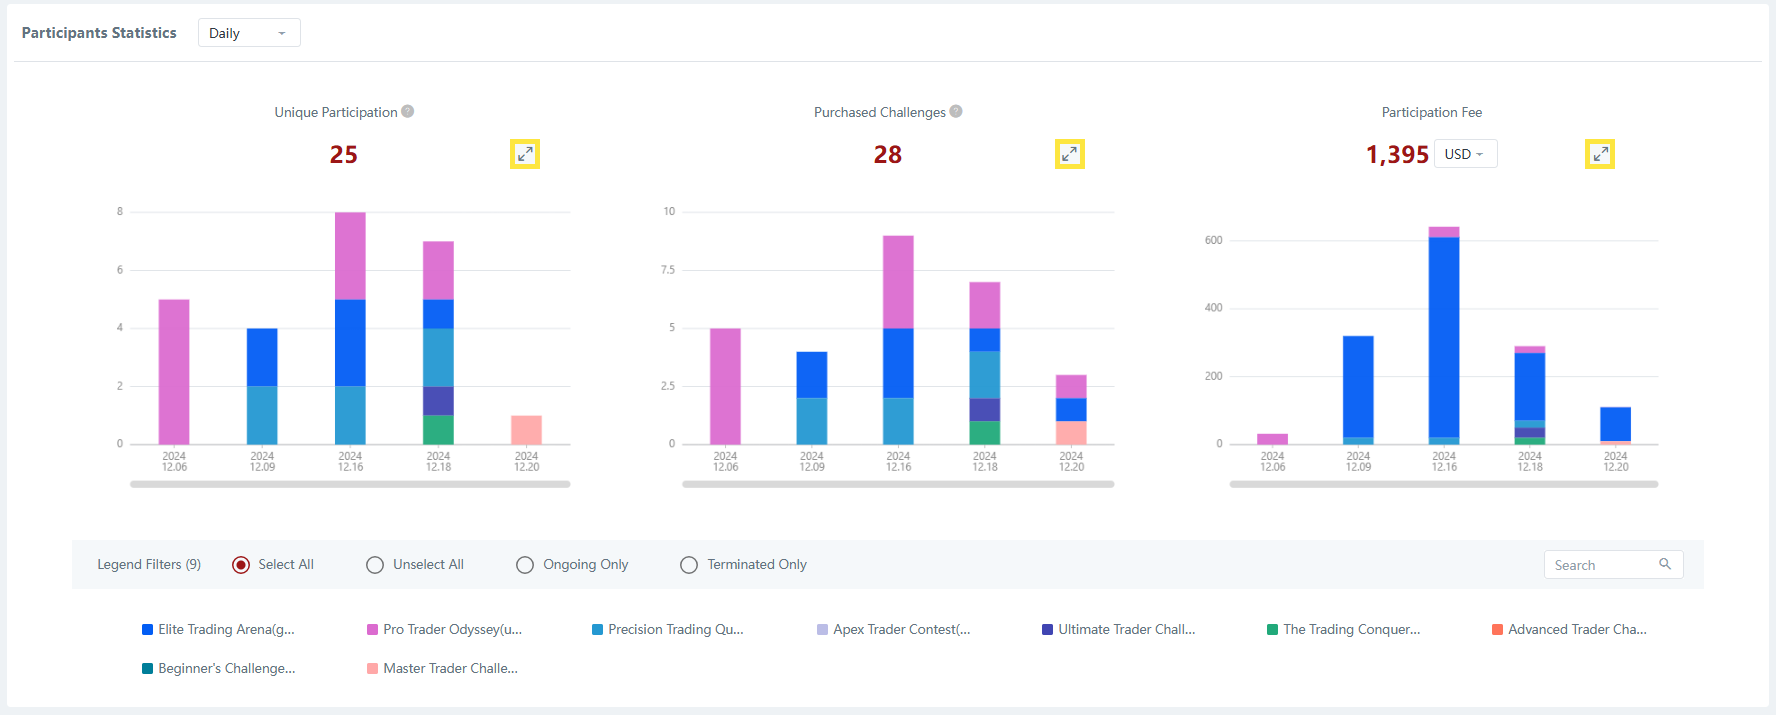
#### D) Participants Statistics
1. The Participants Statistics charts provide a comprehensive view of your prop challenges' participant data, including key metrics such as unique participation, total challenges purchased, and the participation fees collected.
2. Participant statistics include:
* Unique Participation: The total number of distinct clients participating in challenges. Clients participating in multiple challenges are counted once.
* Purchased Challenges: The total number of challenges purchased, including multiple purchases by the same client.
* Participation Fee: The total participation fee collected.
3. You can toggle between Daily or Monthly data using the dropdown menu, allowing you to adjust the chart’s time frame to suit your analysis.
* Selecting Daily will display data on a daily basis, giving you a detailed, day-by-day breakdown of participant statistics.
* Choosing Monthly will show statistics summarized by month, providing a broader view of trends over time.
4. Each chart comes with an expand or collapse feature, allowing you to adjust the display based on your needs.
1. By clicking the expand icon, you can enlarge the chart to focus on detailed data.
2. Conversely, you can click the collapse icon to minimizes the chart, giving you a more streamlined view of the dashboard.
5. Hover over the chart to view detailed insights for each prop challenge.
6. Below the charts, you will find the Legend Filter with quick access buttons to help you refine your data:
* **Select All:** Displays all challenges.
* **Unselect All:** Hides all challenges.
* **Ongoing Only:** Shows only ongoing challenges.
* **Terminated Only:** Shows only terminated challenges.
7. Additionally, below the quick access buttons, you will see a list of prop challenges.
1. You can select or unselect individual challenges to show or hide their data.
2. Greyed-out challenges are hidden, while colored challenges are currently displayed on the chart.
3. To quickly find a specific challenge, use the search function to type the name of the challenge you wish to display or hide. Use Cases for Participants Statistics
1. Unique Participants
1. By analyzing the Unique Participants chart, you can evaluate the appeal and effectiveness of challenges based on the number of new participants they attract daily or each month.
2. This comparison helps identify which challenges are consistently attracting attention and which may be losing popularity.
3. If a challenge shows declining participation, you can adjust its parameters, such as difficulty level or rewards, to boost interest.
4. Challenges with higher engagement can also be prioritized for marketing efforts, ensuring resources are focused on the most successful offerings.
2. Purchased Challenges
1. The Purchased Challenges chart reveals how often challenges are purchased daily or monthly, providing insight into client behavior and engagement.
2. Comparing this data with the Unique Participants chart allows you to assess which challenges are driving repeat purchases.
3. High purchase frequency by returning clients indicates strong retention and satisfaction.
4. Challenges with no repeat purchases may point to retention issues or lack of appeal. This data can help refine challenge offerings, pricing strategies, or incentive programs to improve client engagement.
3. Participation Fee
1. The Participation Fee chart tracks the total fees collected across different challenges, offering insights into the financial performance of each challenge.
2. By analyzing this data, you can identify which challenges are generating the most revenue and assess their profitability and market appeal.
3. Comparing fee revenue across challenges helps determine which pricing models or promotional strategies are most effective, guiding decisions on fee adjustments, marketing strategies, or the introduction of new challenge packages to maximize revenue and attract more participants.
#### E) Challenge Performance Statistics
1. This chart displays the success and failure rates of your prop challenges across their various stages.
2. You can select which prop challenge you would like to view performance statistics for by choosing it from the dropdown menu.
3. The statistics are divided into two charts:
* Successful Participants: Participants who successfully passed the challenge.
* Unsuccessful Participants: Participants who failed to pass the challenge.
Use Cases for Challenge Performance Statistics
The Challenge Performance Statistics helps you analyze the success rates of each challenge, evaluating how well it filters skilled traders.
* A high success rate with a low failure rate might suggest the challenge is too easy, requiring adjustments to ensure only highly skilled traders advance.
* A high failure rate may indicate the challenge is appropriately difficult, but you might consider introducing repeat incentives to boost engagement while maintaining a challenging environment.
### **2) Data Type Functionality**
You can tag your prop traders as "Real" or "Demo" to ensure your Prop Challenge Dashboard reflects only live client data, providing cleaner and more actionable insights for effective decision-making.
To do so, follow these steps:
{% stepper %}
{% step %}
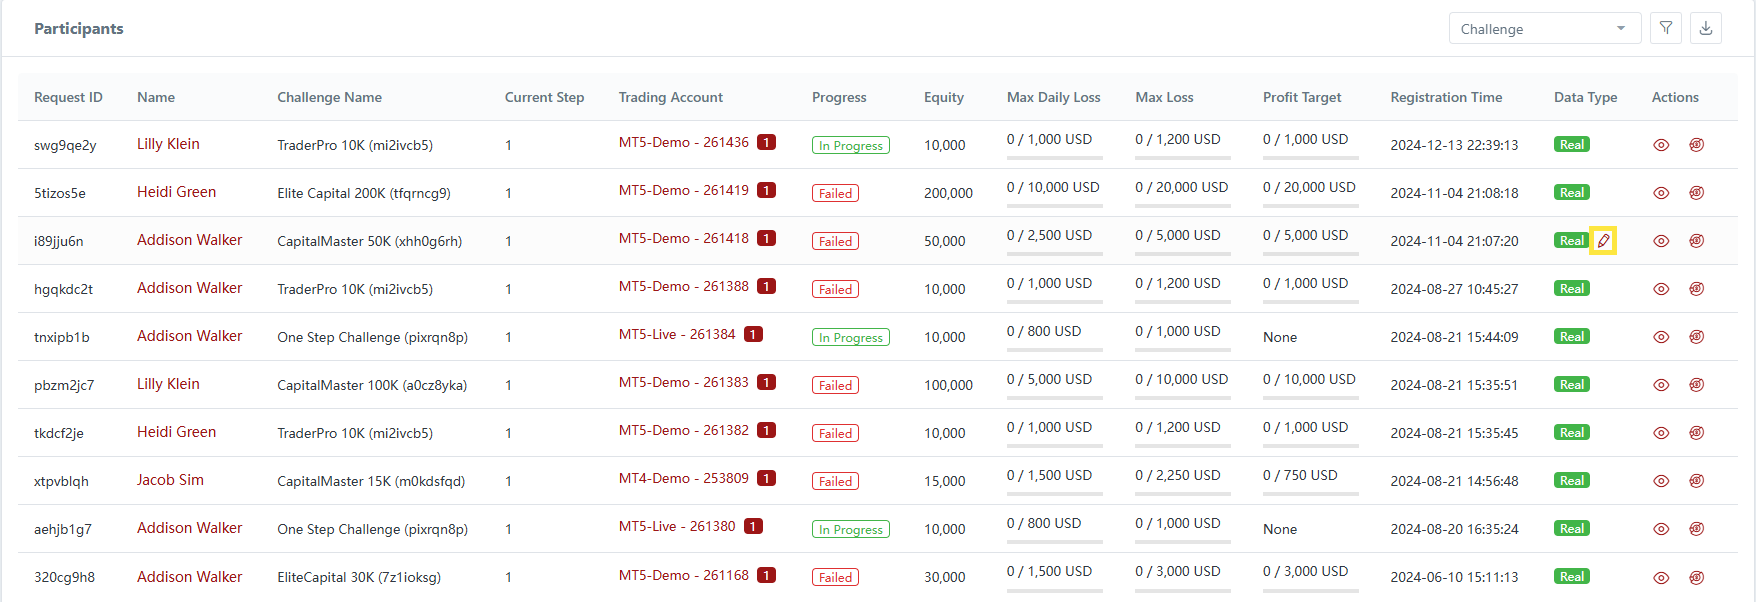
### Navigate to Participants
1. Navigate to Prop Trading > Participants.
{% endstep %}
{% step %}
### Amend Data Type
1. Locate the client you want to amend Data Type for.
2. Click the "Edit" icon.
3. Select "Real" or "Demo".
{% endstep %}
{% step %}
### Save Your Changes
1. Click "Save". \

2. The Data Type will be updated accordingly and the data from this participant will no longer be considered or displayed in the Prop Dashboard.
{% endstep %}
{% endstepper %}
### **3) Enhanced Reporting Capabilities**
#### **A) Participant Report with Improved Filtering**
You can now quickly identify participant activity with the newly added "Challenge ID" and "Challenge Name" fields, making it easier to track which challenges they are enrolled in and enhancing overall clarity.
#### **B) New 24-Hour Filter**
You can now analyze participants' short-term performance by viewing the movement of balance and equity over the last 24 hours, offering valuable insights into traders' recent profitability and performance trends.
Previously, only the last 7 days and last 30 days filters were available. The addition of the 24-hour filter allows for more granular tracking of short-term performance.
This feature is available in both the Client Portal and Back Office Portal.